What analytics are available for programmatic advertising on Genuin?
Programmatic advertising without analytics is guesswork. On Genuin, analytics within the Brand Control Center are designed to help brands track revenue, optimize ad performance, and make data-driven monetization decisions.
This matters because:
- You can measure real revenue impact, not just ad delivery
- You can identify high-performing placements, formats, and partners
- You can optimize CPM, fill rates, and engagement in real time
- You can confidently report ROI to internal teams and brand partners
Ultimately, analytics turn your monetization setup into a continuous optimization engine, not a static configuration.
Guide — How analytics work for programmatic advertising
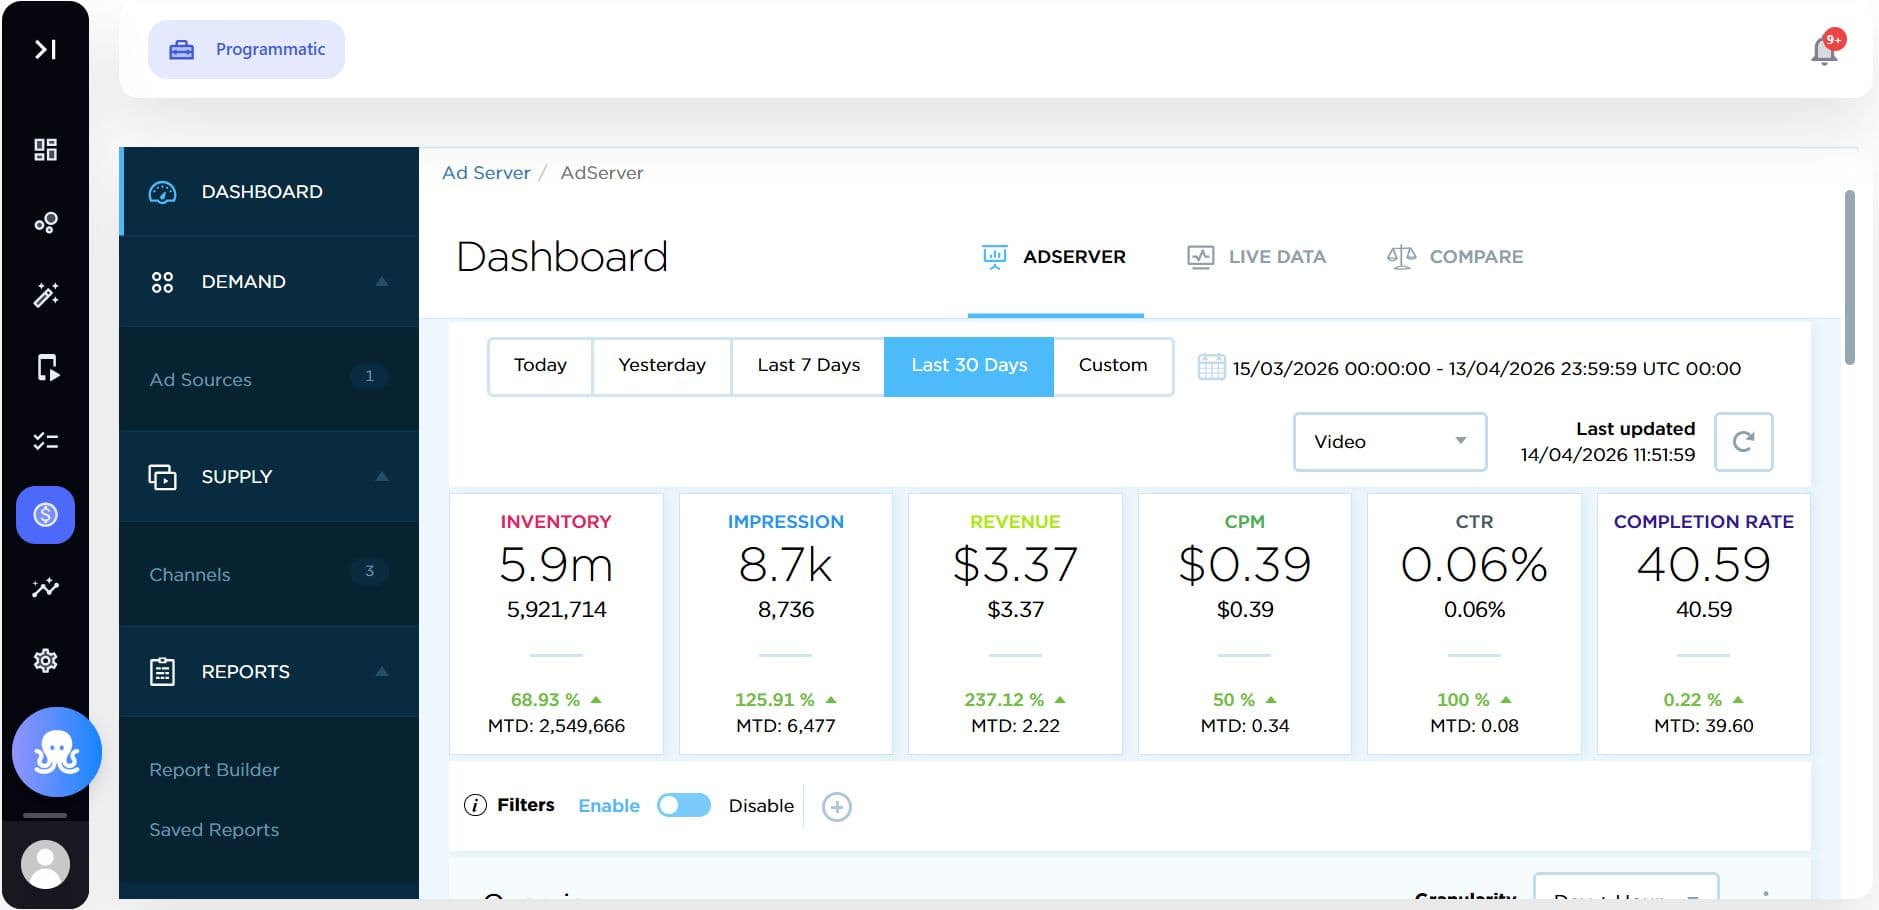
Step 1: Access Programmatic Analytics
Navigate to: Brand Control Center > Monetize > Programmatic Dashboard
Here you can view:
- Adserver reports
- Content-level performance
- CDN and delivery insights
Step 2: Select Report Type
Choose the type of report based on your objective:
| Report Type | Use Case |
|---|---|
| Adserver | Revenue, impressions, CPM tracking |
| Content | Performance of videos with ads |
| CDN | Delivery and playback performance |
Step 3: Apply Date Range & Time Filters
Use flexible filters to analyze trends:
| Filter | Options |
|---|---|
| Date Range | Today, Yesterday, Last 7 Days, Last 30 Days, Custom |
| Time Zone | Configurable per brand |
This helps compare short-term vs long-term performance trends.
Step 4: Analyze Core Metrics
Genuin supports key programmatic KPIs that directly impact revenue and performance:
| Metric | What it tells you |
|---|---|
| Impressions | Number of times ads were served |
| Revenue | Total earnings from ads |
| CPM | Revenue per 1,000 impressions |
| CTR | Engagement with ads |
| Completion Rate | % of video ads watched fully |
| Inventory | Available ad slots |
| Fill Rate | % of ad slots successfully filled |
These are industry-standard metrics used to evaluate campaign effectiveness and monetization efficiency
Step 5: Use Dimensions & Filters for Deeper Insights
Break down performance using:
| Dimension | Example Insights |
|---|---|
| Supply (Placements) | Which placements generate highest revenue |
| Demand (Ad Sources / SSPs) | Which partners perform best |
| Device / OS | Web vs iOS vs Android performance |
| Geography | Top performing countries |
| Format | Video vs Display vs Native |
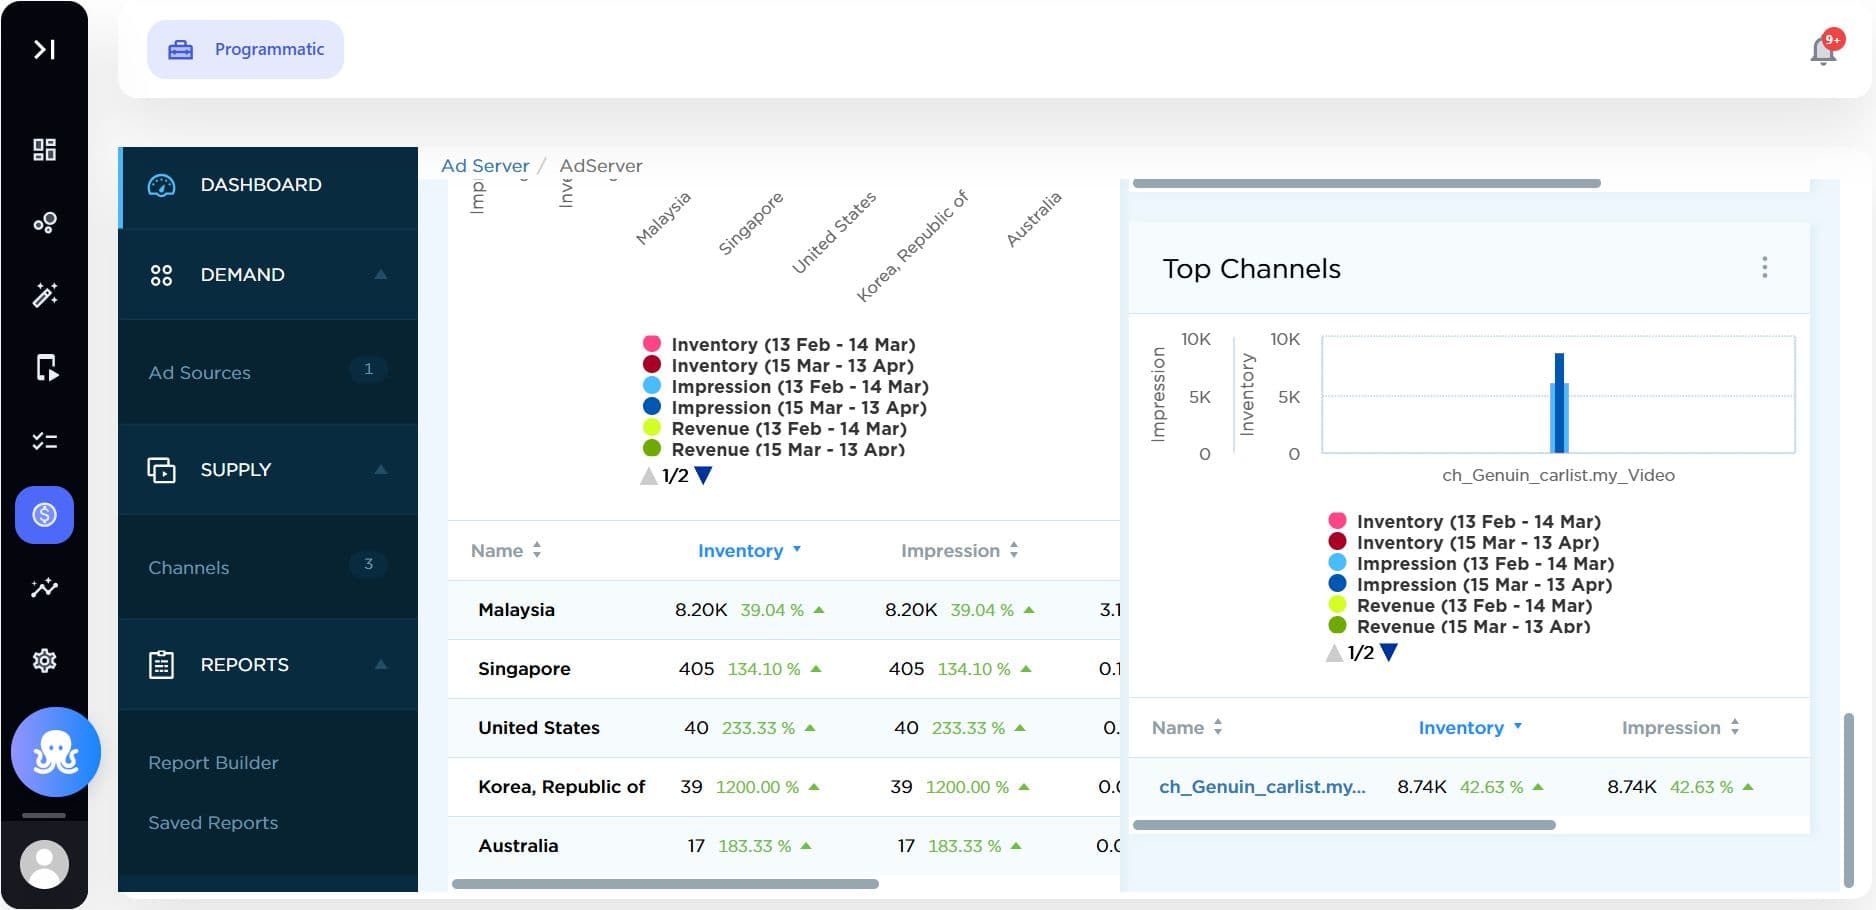
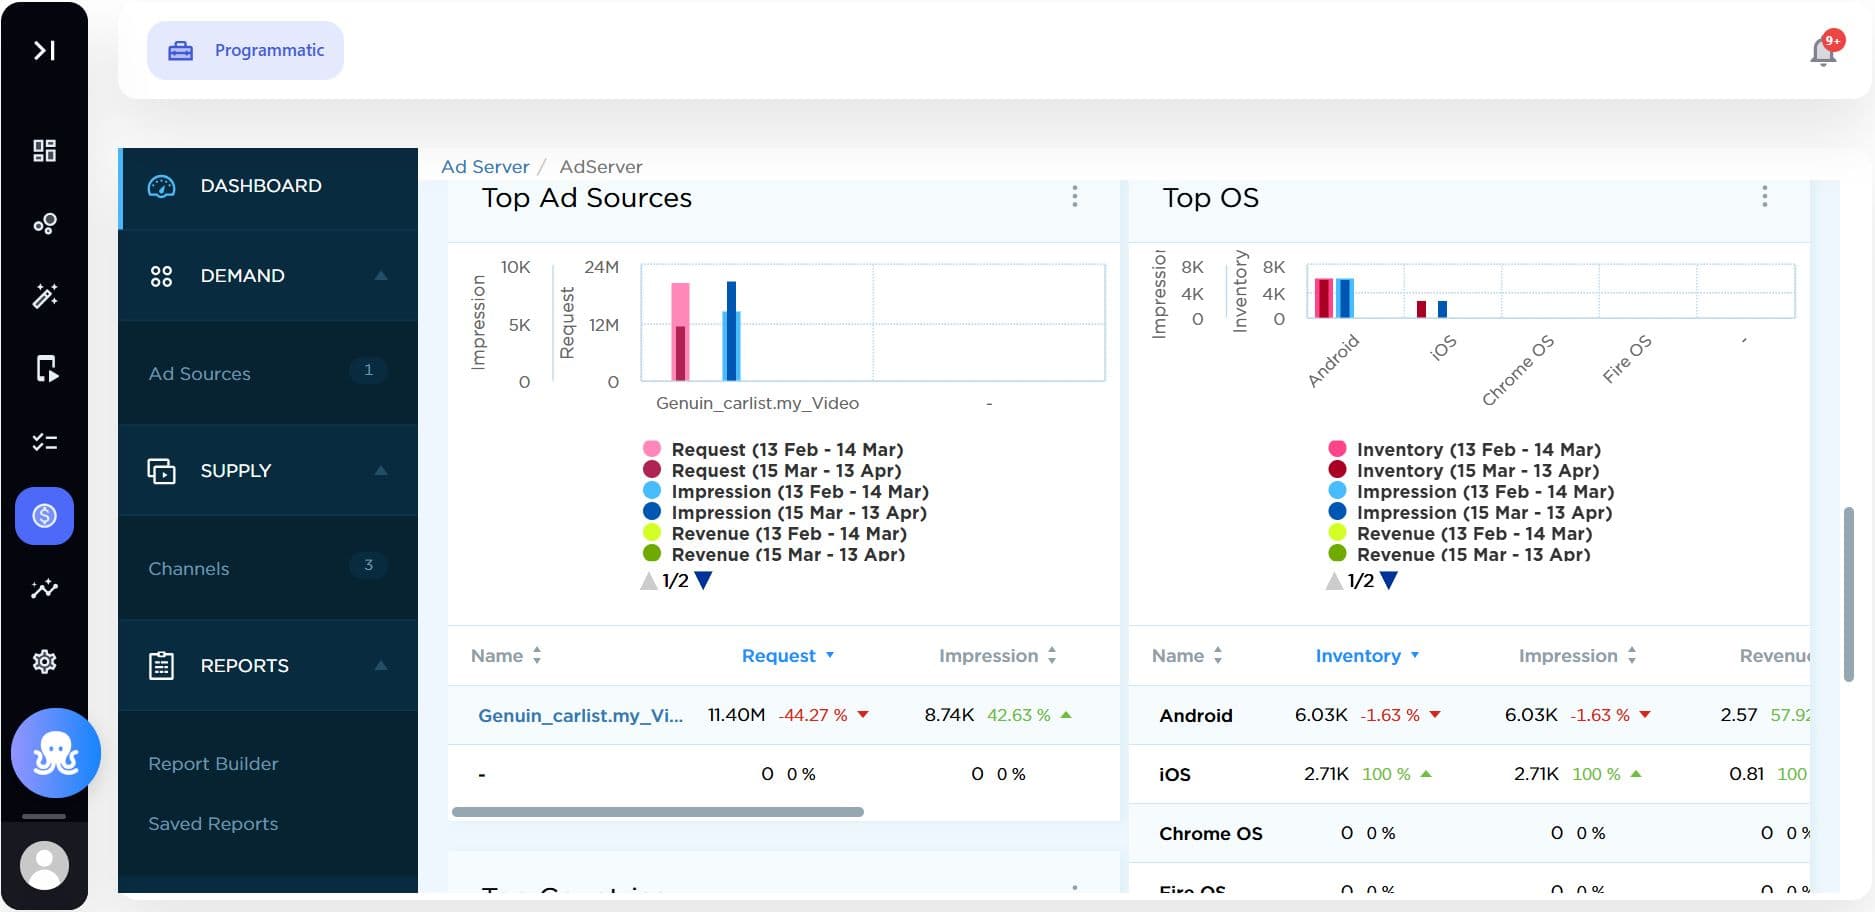
Step 6: Monitor Performance Views
Genuin provides ready insights like:
- Top Ad Sources
- Top Channels (placements & embeds)
- Top Operating Systems
- Top Countries
This helps you quickly identify where to scale or optimize.
Specs & Limitations
System Capabilities
| Area | Behavior |
|---|---|
| Reporting Views | Supply, Demand, Custom |
| Revenue Views | Totals, Ratios, Custom |
| Formats Supported | Video, Display, All |
| Data Granularity | Placement, platform, geography |
| Real-Time Data | Available via Live reporting |
Limitations (Current Phase)
| Limitation | Impact |
|---|---|
| No predictive analytics | Optimization is manual |
| No automated recommendations | Requires human analysis |
| No A/B testing insights | Must compare manually |
| No cross-brand benchmarking | Data limited to brand scope |
Example Scenarios
1. Identifying high-revenue placements
A brand notices:
- High impressions but low revenue on a placement
Action:
- Check CPM and fill rate
- Switch to a different preset (e.g., balanced - aggressive)
2. Optimizing ad partners
You see:
- One SSP has low fill rate
Action:
- Reorder priority in ad presets
- Replace or deprioritize that demand partner
3. Improving user experience
You observe:
- High impressions but low completion rate
Action:
- Reduce frequency
- Adjust in-stream ad types (e.g., remove mid-roll)
4. Platform-level optimization
You find:
- iOS has better CPM than Web
Action:
- Create environment-specific presets
- Increase ad density on high-performing platforms
FAQ’s
1. What is the most important metric to track?
Depends on your goal:
- Revenue focus - CPM, Revenue
- Engagement focus - CTR, Completion Rate
- Supply efficiency - Fill Rate
2. How is revenue calculated?
Revenue is derived from:
- CPM-based earnings (per 1,000 impressions)
- Sponsorship + programmatic demand combined
3. Why is my fill rate low?
Possible reasons:
- Low demand from SSPs
- Strict targeting
- Low-quality inventory
4. Can I track performance per placement?
Yes. Use Supply/Channel view to analyze placement-level performance.
5. Do analytics update in real time?
Yes, Live Data reporting is available, but some aggregation may have slight delays.
