How Can Brands Track and Analyze Content Interactions in Reports?
Content interactions provide direct insight into how users engage with videos, posts, communities, groups, and campaigns across the Community Media Network.
By analyzing interaction data, brands can understand:
- Which content drives the highest engagement
- What formats resonate with audiences
- How users participate within communities
- Which campaigns generate the most activity
- What improves retention and repeat visits
- How creators and communities perform over time
Inside the Brand Control Center, content interaction reports help brands transform engagement signals into actionable growth strategies.
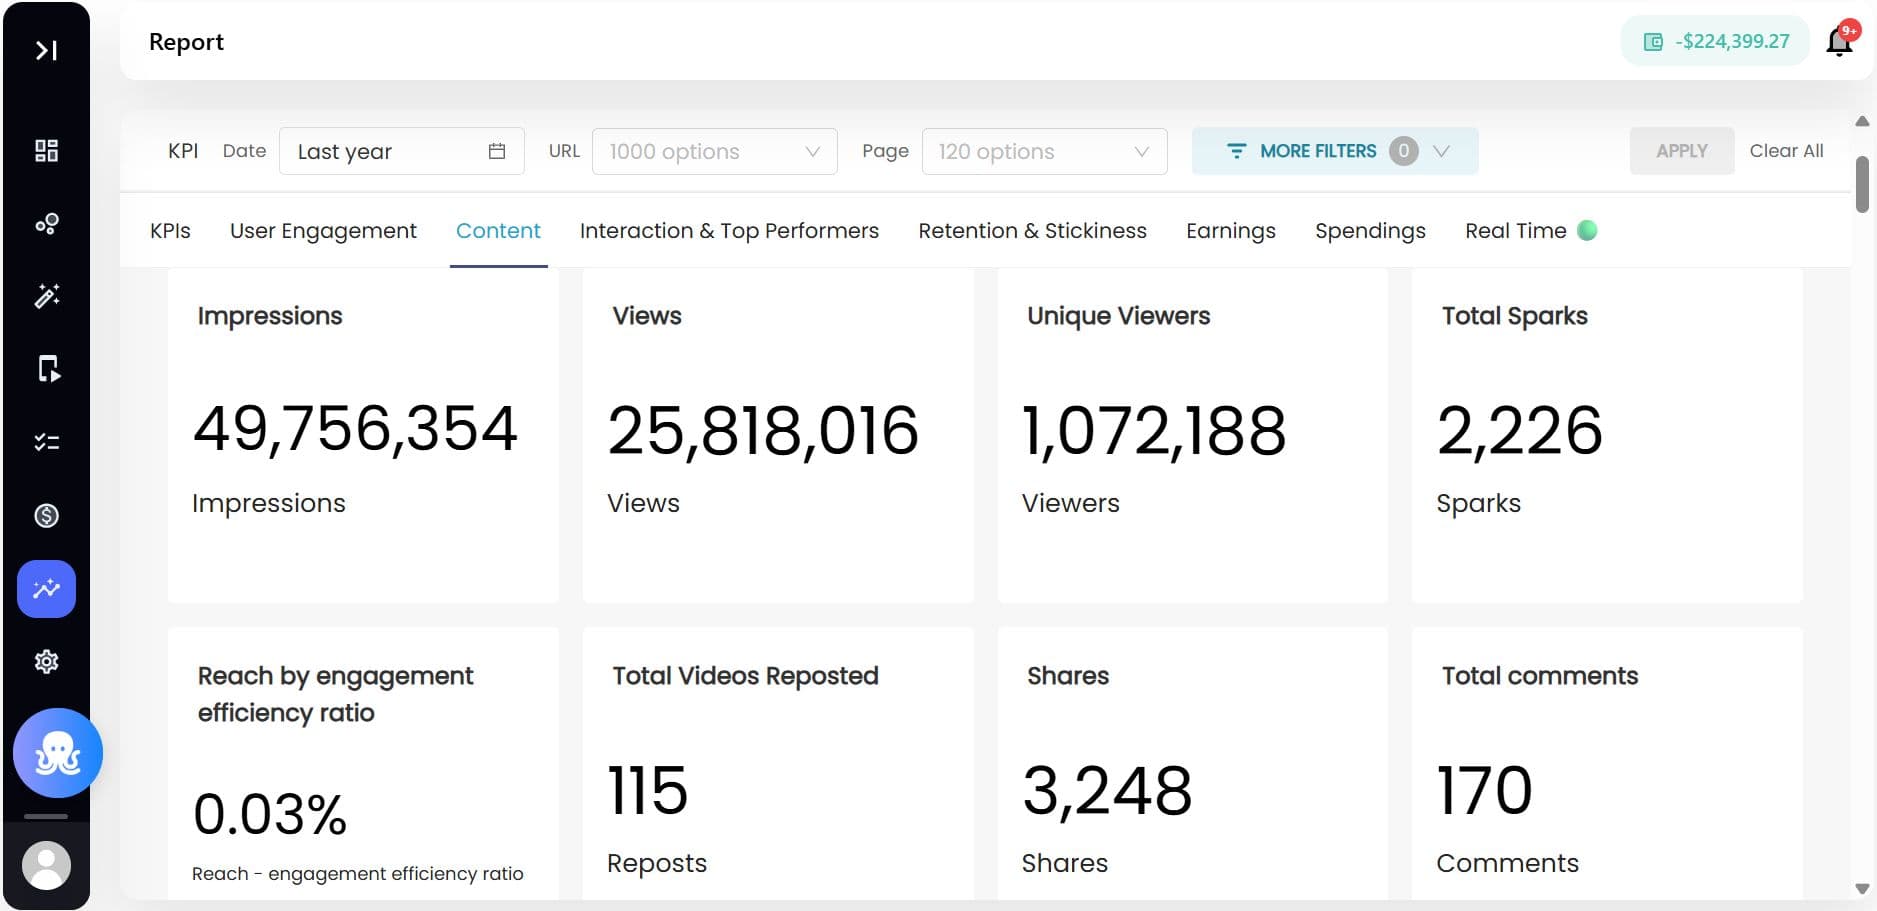
What Are Content Interactions?
Content interactions are engagement signals generated when users engage with content across web, app, communities, embeds, or campaigns.
These interactions may include:
| Interaction Type | Description |
|---|---|
| Video Views | Number of content plays |
| Completion Rate | Percentage of video watched |
| Sparks (Likes) | Positive engagement signals |
| Comments | User discussions and feedback |
| Shares | Content distribution activity |
| Saves/Bookmarks | Intent to revisit content |
| Click-Through Actions | Navigation or CTA engagement |
| Group Participation | Interactions inside groups |
| Community Engagement | Participation across communities |
| Session Duration | Time spent consuming content |
| Repeat Visits | Returning engagement behavior |
These metrics help brands evaluate both content quality and audience intent.
How to Access Content Interaction Reports
Step 1: Login to Brand Control Center
Access the Brand Control Center using administrator credentials.
Step 2: Navigate to Reports
Go to: Reports > Content Analytics
Depending on your configuration, interaction insights may also be available under:
- Community Reports
- Engagement Reports
- Campaign Analytics
- Creator Analytics
- Monetization Reports
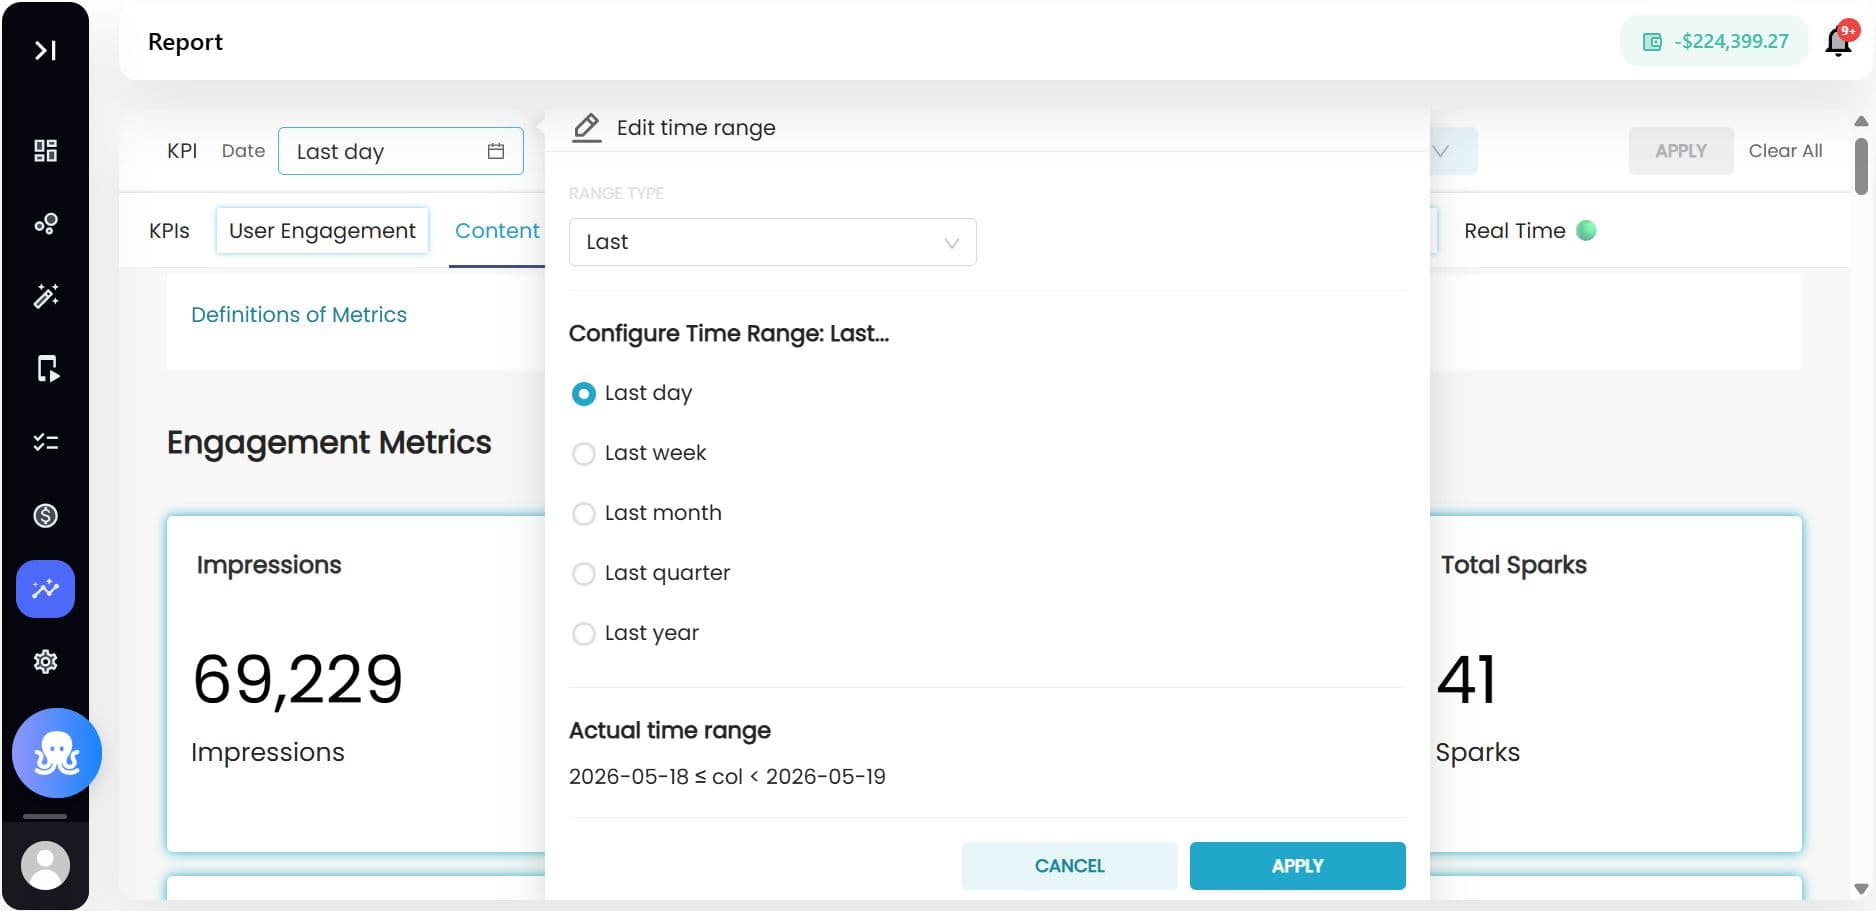
Step 3: Select the Reporting Range
Choose the reporting period.
Supported filters may include:
| Filter Option | Purpose |
|---|---|
| Today | Same-day performance |
| Yesterday | Previous day analysis |
| Last 7 Days | Weekly trends |
| Last 30 Days | Monthly analysis |
| Custom Range | Flexible reporting periods |
Brands can also configure timezone-based reporting for regional analysis.
Key Content Interaction Metrics to Analyze
1. Video Views
Measures total content reach and consumption volume.
Why It Matters
- Evaluates content visibility
- Measures audience exposure
- Identifies high-reach campaigns
2. Completion Rate
Tracks how much of the content users watch before exiting.
Why It Matters
High completion rates often indicate:
- Strong storytelling
- Relevant topics
- Effective pacing
- Better audience alignment
Low completion rates may signal weak engagement or mismatched targeting.
3. Sparks (Likes)
Measures immediate positive engagement.
Why It Matters
Sparks help identify:
- Popular content themes
- Audience sentiment
- Emotional engagement
4. Comments and Discussions
Tracks conversation activity around content.
Why It Matters
Comment activity reveals:
- Community participation
- Audience opinions
- Discussion depth
- Engagement quality
Highly discussed content often drives stronger community retention.
5. Shares and Distribution
Measures how frequently users distribute content externally.
Why It Matters
Shares indicate:
- Organic amplification
- Community advocacy
- Viral potential
- Campaign momentum
6. Community and Group Participation
Measures interactions inside communities and groups.
Why It Matters
This helps brands evaluate:
- Community health
- Group activity levels
- User participation trends
- Topic-specific engagement
7. Session Duration and Time Spent
Tracks how long users remain engaged.
Why It Matters
Longer sessions often indicate:
- Strong personalization
- Relevant content discovery
- Effective community experiences
How Brands Can Use Interaction Data
1. Optimize Content Strategy
Interaction insights help brands identify:
- High-performing content formats
- Trending topics
- Strong creator collaborations
- Best-performing campaigns
Example:
| Observation | Action |
|---|---|
| Tutorials generate higher completion rates | Increase educational content |
| Creator videos drive more shares | Expand creator partnerships |
2. Improve Personalization
Engagement patterns help power:
- Personalized feeds
- AI recommendations
- Interest-based content delivery
- Dynamic onboarding experiences
This improves long-term engagement and retention.
3. Strengthen Community Growth
Brands can analyze:
- Active communities
- Top-performing groups
- User participation trends
- Community retention signals
This helps optimize community structure and engagement strategies.
4. Measure Campaign Performance
Interaction data helps evaluate campaign success.
Brands can measure increases in:
- Views
- Comments
- Shares
- User participation
- Repeat engagement
This creates a measurable feedback loop for campaign optimization.
5. Identify Community Advocates and Creators
Highly engaged users can become:
- Brand advocates
- Community ambassadors
- Creator collaborators
- Moderators
Interaction reports help identify influential contributors within the network.
Advanced Reporting and Data Integrations
Brands requiring deeper analytics can integrate interaction data into external systems through Data Connector integrations.
Supported destinations may include:
- Google BigQuery
- Amazon S3
- Mixpanel
- CRM platforms
- BI and analytics tools
This allows brands to combine community engagement data with broader customer intelligence systems.
Best Practices for Content Interaction Analysis
- Focus on Engagement Quality, Not Just Reach
High views alone do not guarantee meaningful engagement.
Monitor:
- Completion rates
- Comments
- Shares
- Returning visits
These signals provide deeper engagement insights.
2. Analyze Trends Over Time
Track interaction patterns consistently to identify:
- Seasonal shifts
- Emerging interests
- Campaign effectiveness
- Community health changes
3. Segment Reports by Community or Audience
Different audiences behave differently.
Analyze engagement by:
- Community
- Topic
- Creator
- Campaign
- Geography
- Device type
This improves strategic decision-making.
4. Combine Interaction Data with Interest Signals
Combining interaction data with:
- User-generated interests
- Zero-party data
- Community behavior
helps improve personalization and recommendation quality.
Example Use Cases
Media Publishers
Track content performance across entertainment, sports, and lifestyle communities.
Retail Brands
Measure engagement with product launches and creator-led campaigns.
Gaming Communities
Analyze participation during tournaments, live discussions, and challenges.
Education Platforms
Track lesson completion rates and discussion participation.
Creator Networks
Evaluate creator engagement performance and audience interaction quality.
Specs & Limitations
| Area | Details |
|---|---|
| Data Availability | Depends on enabled reporting configuration |
| Real-Time Insights | May vary based on reporting infrastructure |
| Historical Reporting | Available based on data retention settings |
| Community Analytics | Supported across communities and groups |
| External Integrations | Requires Data Connector setup |
| AI Recommendations | Improved through interaction signal quality |
| Campaign Reporting | Available for supported campaign activations |
| Personalization Accuracy | Depends on engagement consistency and volume |
